Math 22 Graph of Equation
The Graph of an Equation
The graph of an equation is the set of all points that are solutions of the equation.
In this section, we use point-plotting method. With this method, you construct a table of values that consists of several solution points of the equation
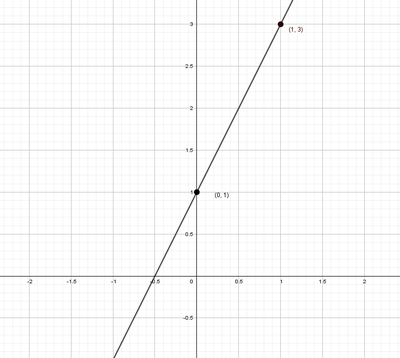
For example, sketch the graph of . We can construct the table below by plugging points for Failed to parse (MathML with SVG or PNG fallback (recommended for modern browsers and accessibility tools): Invalid response ("Math extension cannot connect to Restbase.") from server "https://wikimedia.org/api/rest_v1/":): {\displaystyle x} .
| x | 0 | 1 | 2 | 3 |
| y=2x+1 | 1 | 3 | 5 | 7 |
Intercepts of a Graph
Some solution points have zero as either the Failed to parse (MathML with SVG or PNG fallback (recommended for modern browsers and accessibility tools): Invalid response ("Math extension cannot connect to Restbase.") from server "https://wikimedia.org/api/rest_v1/":): {\displaystyle x} -coordinate or the Failed to parse (MathML with SVG or PNG fallback (recommended for modern browsers and accessibility tools): Invalid response ("Math extension cannot connect to Restbase.") from server "https://wikimedia.org/api/rest_v1/":): {\displaystyle y} -coordinate. These points are called intercepts because they are the points at which the graph intersects the Failed to parse (MathML with SVG or PNG fallback (recommended for modern browsers and accessibility tools): Invalid response ("Math extension cannot connect to Restbase.") from server "https://wikimedia.org/api/rest_v1/":): {\displaystyle x} - or Failed to parse (MathML with SVG or PNG fallback (recommended for modern browsers and accessibility tools): Invalid response ("Math extension cannot connect to Restbase.") from server "https://wikimedia.org/api/rest_v1/":): {\displaystyle y} -axis.
This page were made by Tri Phan

