Find producer and consumer surpluses if the supply curve is given by
, and the demand curve is given by Failed to parse (MathML with SVG or PNG fallback (recommended for modern browsers and accessibility tools): Invalid response ("Math extension cannot connect to Restbase.") from server "https://wikimedia.org/api/rest_v1/":): {\displaystyle p = 150 - 4x}
.
| Foundations:
|
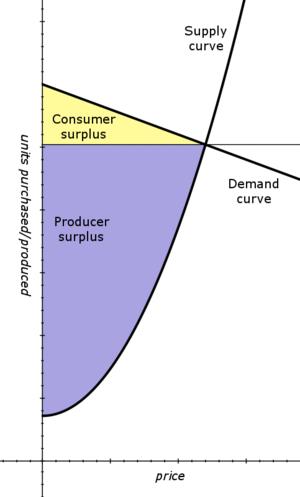
| The supply curve and the demand curve are tied to price of a product. As the price goes up, manufacturers would be willing to produce more, so the supply curve is usually increasing. On the other hand, as the price goes up, fewer consumers might purchase the product, so the demand curve is usually decreasing.
At some sale price, these two curves intersect at an equilibrium point. When we speak of consumer surplus and producer surplus, we are talking about the total area under between the horizontal line through the equilibrium level of units, and the demand curve or supply curve, respectively. We need to integrate the areas indicated on the graph to find actual values for these two surpluses.
|
Solution:
| Step 1:
|
| Find the equilibrium point: Since we are given equations for both curves, we need to set them equal and solve for Failed to parse (MathML with SVG or PNG fallback (recommended for modern browsers and accessibility tools): Invalid response ("Math extension cannot connect to Restbase.") from server "https://wikimedia.org/api/rest_v1/":): {\displaystyle x}
. Setting them equal, we have
|
- Failed to parse (MathML with SVG or PNG fallback (recommended for modern browsers and accessibility tools): Invalid response ("Math extension cannot connect to Restbase.") from server "https://wikimedia.org/api/rest_v1/":): {\displaystyle 18+3x^2\,=\,150-4x.}
|
| If we move everything to one side and factor, we find
|
- Failed to parse (MathML with SVG or PNG fallback (recommended for modern browsers and accessibility tools): Invalid response ("Math extension cannot connect to Restbase.") from server "https://wikimedia.org/api/rest_v1/":): {\displaystyle 3x^2+4x-132\,=\,(3x+22)(x-6)\,=\,0.}
|
| This has only one positive root, Failed to parse (MathML with SVG or PNG fallback (recommended for modern browsers and accessibility tools): Invalid response ("Math extension cannot connect to Restbase.") from server "https://wikimedia.org/api/rest_v1/":): {\displaystyle x=6}
. at this point we have the associated height Failed to parse (MathML with SVG or PNG fallback (recommended for modern browsers and accessibility tools): Invalid response ("Math extension cannot connect to Restbase.") from server "https://wikimedia.org/api/rest_v1/":): {\displaystyle p\,=\,126.}
|
| Step 2:
|
| Consumer Surplus: We need to find the triangular area in the graph, and this will mean integrating between Failed to parse (MathML with SVG or PNG fallback (recommended for modern browsers and accessibility tools): Invalid response ("Math extension cannot connect to Restbase.") from server "https://wikimedia.org/api/rest_v1/":): {\displaystyle 0}
and equilibrium Failed to parse (MathML with SVG or PNG fallback (recommended for modern browsers and accessibility tools): Invalid response ("Math extension cannot connect to Restbase.") from server "https://wikimedia.org/api/rest_v1/":): {\displaystyle x}
-value, Failed to parse (MathML with SVG or PNG fallback (recommended for modern browsers and accessibility tools): Invalid response ("Math extension cannot connect to Restbase.") from server "https://wikimedia.org/api/rest_v1/":): {\displaystyle 6}
. Also, we will integrate from the horizontal line through the equilibrium, Failed to parse (MathML with SVG or PNG fallback (recommended for modern browsers and accessibility tools): Invalid response ("Math extension cannot connect to Restbase.") from server "https://wikimedia.org/api/rest_v1/":): {\displaystyle p\,=\,126}
, up to the demand curve, Failed to parse (MathML with SVG or PNG fallback (recommended for modern browsers and accessibility tools): Invalid response ("Math extension cannot connect to Restbase.") from server "https://wikimedia.org/api/rest_v1/":): {\displaystyle p = 150 - 4x}
. We have
|
- Failed to parse (MathML with SVG or PNG fallback (recommended for modern browsers and accessibility tools): Invalid response ("Math extension cannot connect to Restbase.") from server "https://wikimedia.org/api/rest_v1/":): {\displaystyle \begin{array}{rcl} \textrm{Consumer~surplus} & = & {\displaystyle {\displaystyle \int_{0}^{6}(150-4x)-126\, dx}}\\ \\ & = & {\displaystyle \int_{0}^{6}24-4x\, dx}\\ \\ & = & {\displaystyle 24x-2x^{2}}\biggr|_{x=0}^{6}\\ \\ & = & 144-72\,=\,72. \end{array}}
|
| Step 3:
|
| Producer Surplus: Now, we wish to integrate the area from the supply curve up to the horizontal line through our equilibrium point. We have
|
- Failed to parse (MathML with SVG or PNG fallback (recommended for modern browsers and accessibility tools): Invalid response ("Math extension cannot connect to Restbase.") from server "https://wikimedia.org/api/rest_v1/":): {\displaystyle \begin{array}{rcl} \textrm{Producer~surplus} & = & {\displaystyle {\displaystyle \int_{0}^{6}126-(18+3x^{2})\, dx}}\\ \\ & = & {\displaystyle \int_{0}^{6}108-3x^{2}\, dx}\\ \\ & = & 108x-x^{3}\biggr|_{x=0}^{6}\\ \\ & = & 648-216\,=\,432. \end{array}}
|
| Final Answer:
|
| The consumer surplus is Failed to parse (MathML with SVG or PNG fallback (recommended for modern browsers and accessibility tools): Invalid response ("Math extension cannot connect to Restbase.") from server "https://wikimedia.org/api/rest_v1/":): {\displaystyle 72}
, while the producer surplus is Failed to parse (MathML with SVG or PNG fallback (recommended for modern browsers and accessibility tools): Invalid response ("Math extension cannot connect to Restbase.") from server "https://wikimedia.org/api/rest_v1/":): {\displaystyle 432}
.
|
Return to Sample Exam