Question Consider the following function,
Failed to parse (MathML with SVG or PNG fallback (recommended for modern browsers and accessibility tools): Invalid response ("Math extension cannot connect to Restbase.") from server "https://wikimedia.org/api/rest_v1/":): {\displaystyle f(x) = -\sin\left(3x+\frac{\pi}{2}\right)+1}
- a. What is the amplitude?
- b. What is the period?
- c. What is the phase shift?
- d. What is the vertical shift?
- e. Graph one cycle of f(x). Make sure to label five key points.
| Foundations:
|
| 1) For parts (a) - (d), How do we read the relevant information off of Failed to parse (MathML with SVG or PNG fallback (recommended for modern browsers and accessibility tools): Invalid response ("Math extension cannot connect to Restbase.") from server "https://wikimedia.org/api/rest_v1/":): {\displaystyle A\sin(Bx + C) + D?}
|
| 2) What are the five key points when looking at Failed to parse (MathML with SVG or PNG fallback (recommended for modern browsers and accessibility tools): Invalid response ("Math extension cannot connect to Restbase.") from server "https://wikimedia.org/api/rest_v1/":): {\displaystyle \sin(x)?}
|
| Answer:
|
| 1) The amplitude is A, the period is Failed to parse (MathML with SVG or PNG fallback (recommended for modern browsers and accessibility tools): Invalid response ("Math extension cannot connect to Restbase.") from server "https://wikimedia.org/api/rest_v1/":): {\displaystyle \frac{2\pi}{B}}
, the horizontal shift is left by C units if C is positive and right by C units if C is negative, the vertical shift is up by D if D is positive and down by D units if D is negative.
|
| 2) Since the Y-value must be less than Failed to parse (MathML with SVG or PNG fallback (recommended for modern browsers and accessibility tools): Invalid response ("Math extension cannot connect to Restbase.") from server "https://wikimedia.org/api/rest_v1/":): {\displaystyle \vert x\vert + 1}
, shade below the V. For the circle shde the inside.
|
Solution:
| Step 1:
|
| First we replace the inequalities with equality. So Failed to parse (MathML with SVG or PNG fallback (recommended for modern browsers and accessibility tools): Invalid response ("Math extension cannot connect to Restbase.") from server "https://wikimedia.org/api/rest_v1/":): {\displaystyle y = \vert x\vert + 1}
, and Failed to parse (MathML with SVG or PNG fallback (recommended for modern browsers and accessibility tools): Invalid response ("Math extension cannot connect to Restbase.") from server "https://wikimedia.org/api/rest_v1/":): {\displaystyle x^2 + y^2 = 9}
.
|
| Now we graph both functions.
|
| Step 2:
|
| Now that we have graphed both functions we need to know which region to shade with respect to each graph.
|
| To do this we pick a point an equation and a point not on the graph of that equation. We then check if the
|
| point satisfies the inequality or not. For both equations we will pick the origin.
|
| Failed to parse (MathML with SVG or PNG fallback (recommended for modern browsers and accessibility tools): Invalid response ("Math extension cannot connect to Restbase.") from server "https://wikimedia.org/api/rest_v1/":): {\displaystyle y < \vert x\vert + 1:}
Plugging in the origin we get, Failed to parse (MathML with SVG or PNG fallback (recommended for modern browsers and accessibility tools): Invalid response ("Math extension cannot connect to Restbase.") from server "https://wikimedia.org/api/rest_v1/":): {\displaystyle 0 < \vert 0\vert + 1 = 1}
. Since the inequality is satisfied shade the side of
|
| Failed to parse (MathML with SVG or PNG fallback (recommended for modern browsers and accessibility tools): Invalid response ("Math extension cannot connect to Restbase.") from server "https://wikimedia.org/api/rest_v1/":): {\displaystyle y < \vert x\vert + 1}
that includes the origin. We make the graph of Failed to parse (MathML with SVG or PNG fallback (recommended for modern browsers and accessibility tools): Invalid response ("Math extension cannot connect to Restbase.") from server "https://wikimedia.org/api/rest_v1/":): {\displaystyle y < \vert x\vert + 1}
, since the inequality is strict.
|
| Failed to parse (MathML with SVG or PNG fallback (recommended for modern browsers and accessibility tools): Invalid response ("Math extension cannot connect to Restbase.") from server "https://wikimedia.org/api/rest_v1/":): {\displaystyle x^2 + y^2 \le 9:}
Failed to parse (MathML with SVG or PNG fallback (recommended for modern browsers and accessibility tools): Invalid response ("Math extension cannot connect to Restbase.") from server "https://wikimedia.org/api/rest_v1/":): {\displaystyle (0)^2 +(0)^2 = 0 \le 9}
. Once again the inequality is satisfied. So we shade the inside of the circle.
|
| We also shade the boundary of the circle since the inequality is Failed to parse (MathML with SVG or PNG fallback (recommended for modern browsers and accessibility tools): Invalid response ("Math extension cannot connect to Restbase.") from server "https://wikimedia.org/api/rest_v1/":): {\displaystyle \le}
|
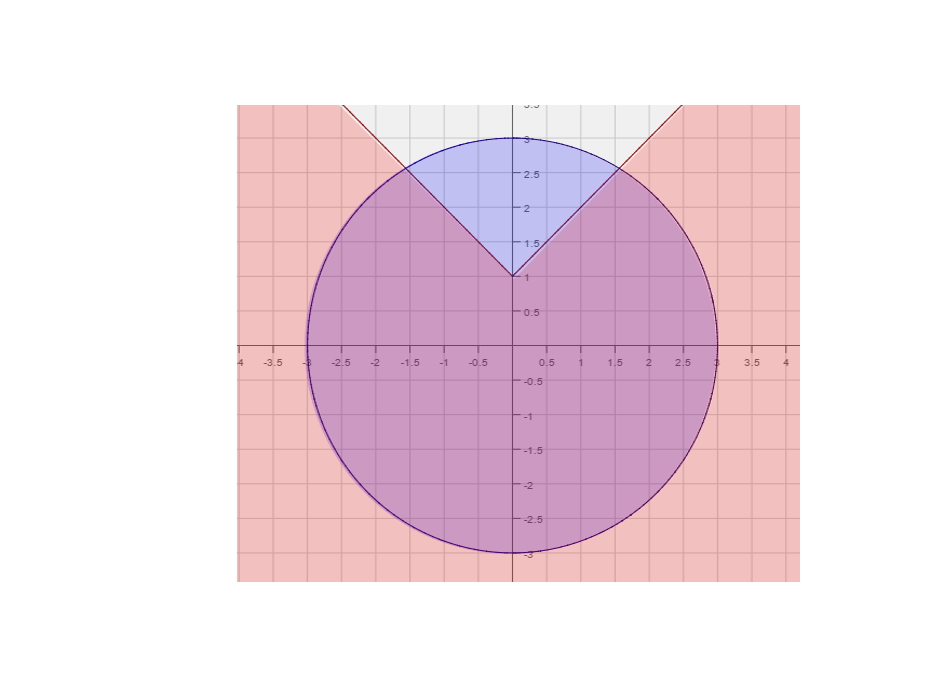
| Final Answer:
|
| The final solution is the portion of the graph that below Failed to parse (MathML with SVG or PNG fallback (recommended for modern browsers and accessibility tools): Invalid response ("Math extension cannot connect to Restbase.") from server "https://wikimedia.org/api/rest_v1/":): {\displaystyle y = \vert x\vert + 1}
and inside Failed to parse (MathML with SVG or PNG fallback (recommended for modern browsers and accessibility tools): Invalid response ("Math extension cannot connect to Restbase.") from server "https://wikimedia.org/api/rest_v1/":): {\displaystyle x^2 + y^2 = 9}
|
| The region we are referring to is shaded both blue and red.
|
|
Return to Sample Exam
