Difference between revisions of "022 Exam 2 Sample B, Problem 2"
Jump to navigation
Jump to search
| Line 14: | Line 14: | ||
::<math>y=A\,f(x-B)+C,</math> | ::<math>y=A\,f(x-B)+C,</math> | ||
|- | |- | ||
| − | |we would have to consider a | + | |we would have to consider a vertical scaling/mirroring of the basic graph from <math style="vertical-align: 0%">A</math>, a horizontal shift from <math style="vertical-align: 0%">B</math>, and a vertical shift from <math style="vertical-align: 0%">C</math>. |
|} | |} | ||
Latest revision as of 08:04, 18 May 2015
Sketch the graph of .
| Foundations: |
|---|
| This is a problem about graphing through transformations. It requires you to find the basic or prototype graph, and then understand how to apply the transformations. In particular, if our basic graph is |
|
|
| and we have a transformed graph |
|
|
| we would have to consider a vertical scaling/mirroring of the basic graph from , a horizontal shift from , and a vertical shift from . |
Solution:
| Step 1: |
|---|
| Identify the Basic Graph: The basic graph is |
|
|
| If you do not know exactly what this looks like, plot the basic points: |
|
|
| I would always recommend plotting the basic graph, in order to show that you properly applied the transformations. Note that since our base is less than one, the basic graph will be decreasing. |
| Step 2: |
|---|
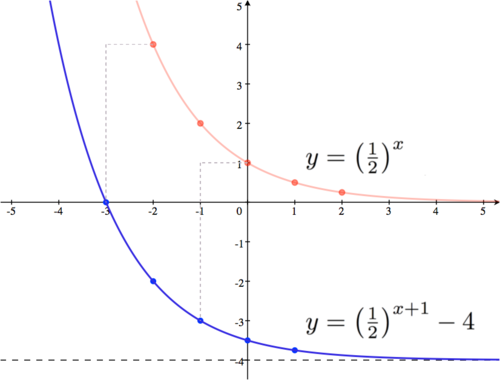
| Verify the Transformations: Here, we need to shift the basic graph down by four, while moving it to the left one (as the argument is zero when ). Note that since the basic graph has an asymptote at the -axis, we will shift the asymptote to the line |
| Final Answer: |
|---|
| In addition to your final graph, for grading purposes you should show your basic graph, the new asymptote and the translations of a few points. The red dots show the values for the basic graph from the chart in step 1. Many teachers will also ask that you label a few points on your final graph (shown here in blue).
|


