Difference between revisions of "Math 22 Graph of Equation"
Jump to navigation
Jump to search
| Line 21: | Line 21: | ||
|} | |} | ||
| − | [[File:graph 1.2.png|center| | + | So, we can sketch the graph from those order pairs. |
| + | |||
| + | [[File:graph 1.2.png|center|500px]] | ||
==Intercepts of a Graph== | ==Intercepts of a Graph== | ||
Revision as of 07:45, 13 July 2020
The Graph of an Equation
The graph of an equation is the set of all points that are solutions of the equation.
In this section, we use point-plotting method. With this method, you construct a table of values that consists of several solution points of the equation
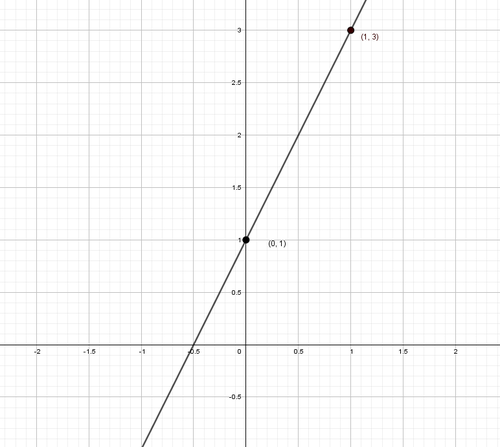
For example, sketch the graph of . We can construct the table below by plugging points for .


| x | 0 | 1 | 2 | 3 |
| y=2x+1 | 1 | 3 | 5 | 7 |
So, we can sketch the graph from those order pairs.

Intercepts of a Graph
Some solution points have zero as either the -coordinate or the -coordinate. These points are called intercepts because they are the points at which the graph intersects the - or -axis.

This page were made by Tri Phan